Kubernetes Security Metrics Monitoring Kubescape
Table of Contents
Kubernetes Security

This article, on the other hand, is a stand alone guide to quickly deploy both Prometheus-Stack and Kubescape Helm charts and build a Grafana dashboard to visualize Kubernetes security compliance scores and control status.
So, you don’t have to read the previous article to follow this one. However, if you need the rational and motivation of why you should monitor your cluster security metrics in the first place, go have a look.
Security frameworks used in this setup
Security Frameworks refer to the standards used to compare kubernetes security posture against.
In this case, we use MITRE ATT&CK and the NSA Kubernetes Hardening Guidance. These are enabled by default in Kubescape.
Here is a quick presentation of both of them:
MITRE ATT&CK
- What it is: MITRE ATT&CK is a globally accessible knowledge base of tactics and techniques used by adversaries (hackers) throughout the cyberattack lifecycle.
- Organization: It maps attacker behaviors to specific phases of an attack like initial access, execution, persistence, privilege escalation, etc.
- Kubescape Integration: Kubescape scans your Kubernetes environment and maps potential vulnerabilities to the MITRE ATT&CK framework. This provides:
- Context: Understanding the real-world tactics a vulnerability might enable an attacker to use.
- Prioritization: Helping you focus on the most critical risks based on known attacker tendencies.

NSA Kubernetes Hardening Guidance
- What it is: A comprehensive guide released by the National Security Agency (NSA) and Cybersecurity and Infrastructure Security Agency (CISA) outlining security best practices for Kubernetes deployments.
- Focus: It covers areas like:
- Pod security and network policies
- Authentication and authorization configurations
- Secure secret and image management
- Logging and auditing
- Kubescape Integration: Kubescape scans your Kubernetes environment against the NSA Kubernetes Hardening Guidance. This helps you:
- Identify misconfigurations: Deviations from the recommended security standards are flagged.
- Remediation guidance: Kubescape often provides advice on how to rectify issues to comply with NSA guidance.
Why they’re enabled by default in Kubescape
- Criticality: Both MITRE ATT&CK and the NSA Hardening Guidance represent crucial security foundations.
- Actionable insights: Kubescape doesn’t just scan; it presents the results in ways that help you take meaningful action to harden your Kubernetes installations.
Sounds interesting, huh !!? Now, let’s deploy stuff 🚀.
Step-by-Step Walkthrough
Prerequisites
- A running Minikube cluster.
- Basic understanding of Kubernetes concepts and the use of kubectl.
In this guide, we will deploy everything using helm on the command line (no Terraform this time).
This is not the best deployment strategy since it is not “declarative”, aka cannot be saved as code in a repository.
Instead, we will be using imperative helm commands to be quick (and dirty 😜).
Start the minikube cluster
minikube start
Deploy prometheus-stack helm chart
helm repo add prometheus-community https://prometheus-community.github.io/helm-charts
helm repo update
kubectl create namespace prometheus
helm install -n prometheus kube-prometheus-stack prometheus-community/kube-prometheus-stack \
\–set prometheus.prometheusSpec.podMonitorSelectorNilUsesHelmValues=false,prometheus.prometheusSpec.serviceMonitorSelectorNilUsesHelmValues=false
Deploy kubescape-operator helm chart
First we need to add the helm repo:
helm repo add armo https://kubescape.github.io/helm-charts/
helm repo update
Then, install kubescape operator using the following configuration flags:
helm upgrade –install kubescape kubescape/kubescape-operator \
-n kubescape –create-namespace \
--set clusterName=`kubectl config current-context` \
\–set kubescape.serviceMonitor.enabled=true \
\–set kubescape.serviceMonitor.namespace=prometheus \
\–set kubescape.submit=false \
\–set kubescape.enableHostScan=false \
\–set kubescape.downloadArtifacts=false \
\–set account=“abc123”
The account=”abc123" needs to be set to a value even if you are not planning to use their Saas backend (skipping will prevent your operator pod from running).
This should be enough to set up your Kubescape scanners to work on the cluster and start exposing Prometheus metrics thanks to the serviceMonitor.
Connect to Grafana
To connect to Grafana, first get the password of the admin user by typing this command:
kubectl get secret –namespace prometheus \
kube-prometheus-stack-grafana \
-o jsonpath="{.data.admin-password}" | base64 - decode ; echo
Then, open a port-forward from you local machine to grafana service like this:
kubectl port-forward -n prometheus service/kube-prometheus-stack-grafana 3000:80
Optional: connect to Prometheus
If you want to log into Prometheus to check if the Kubescape serviceMonitor is up, do the same with prometheus service (no need for credentials like Grafana):
kubectl port-forward -n prometheus service/kube-prometheus-stack-prometheus 9090
Create a basic dashboard
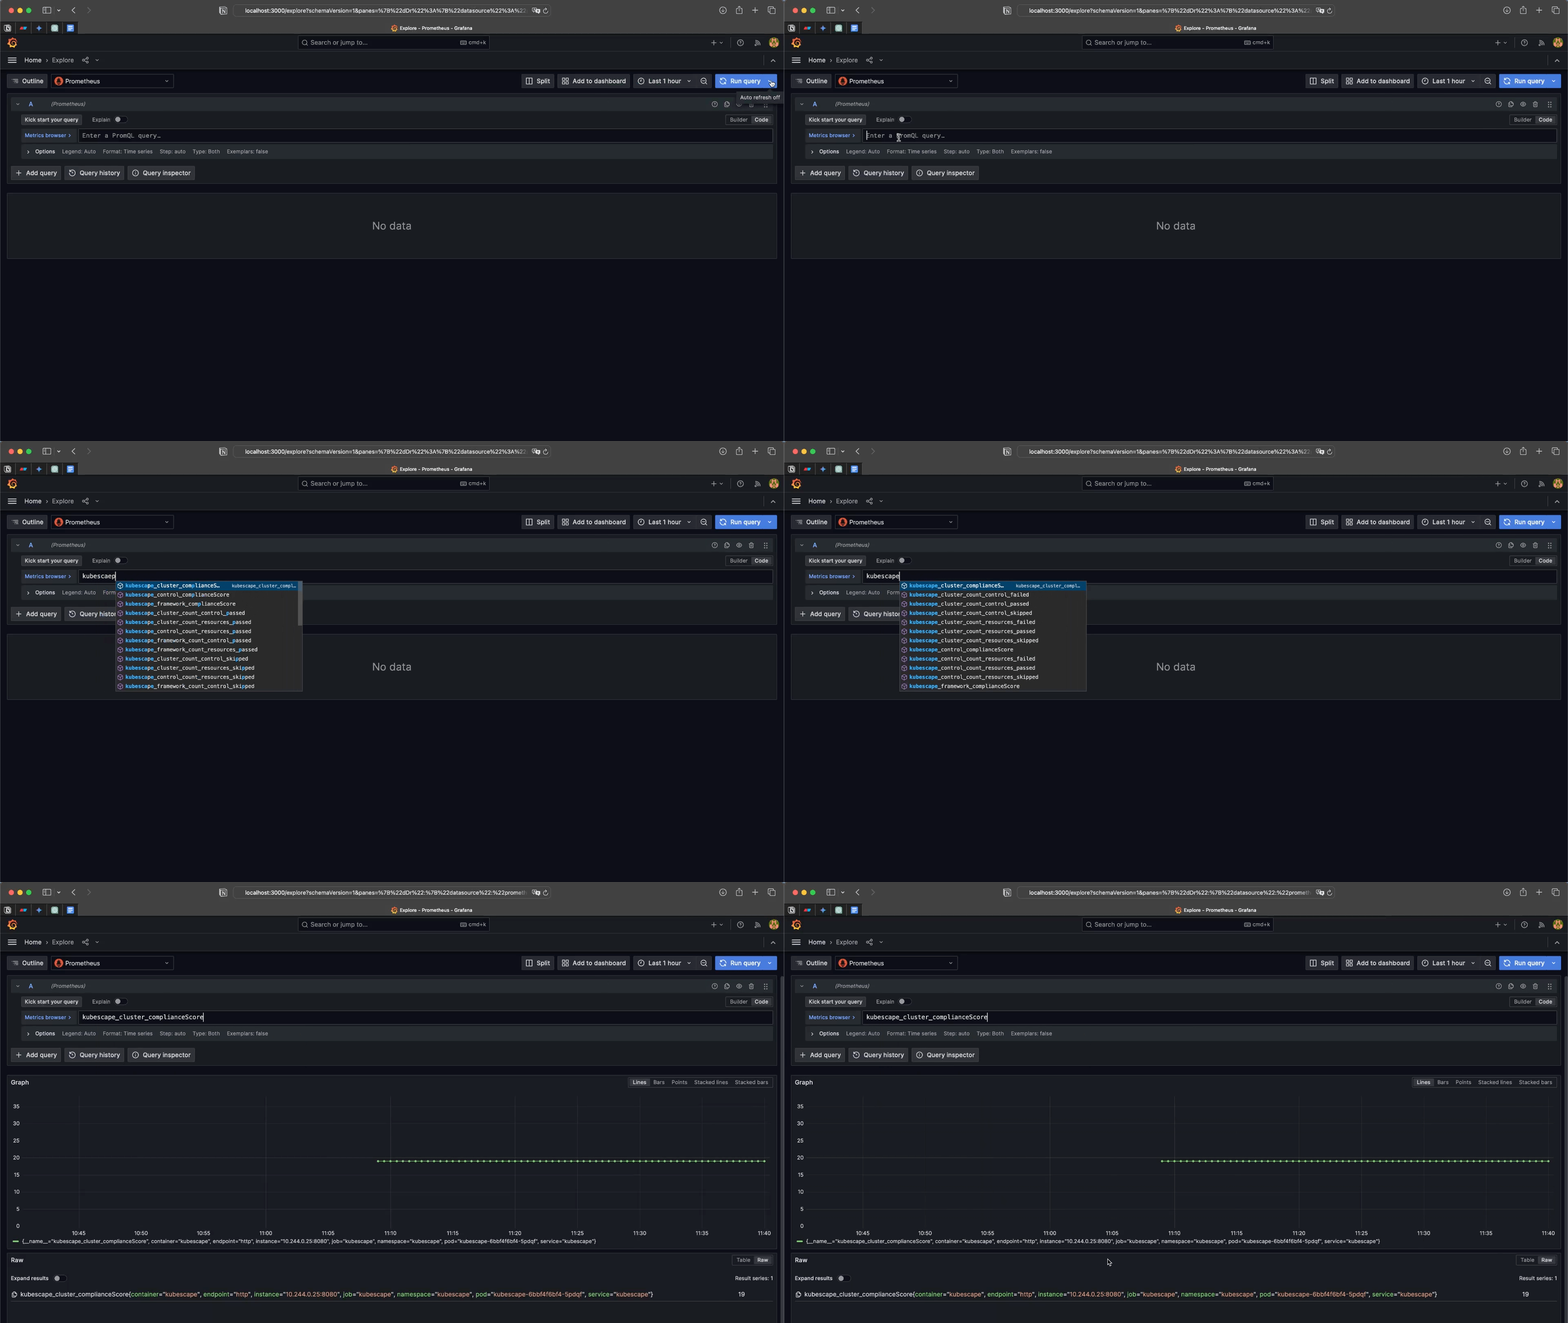
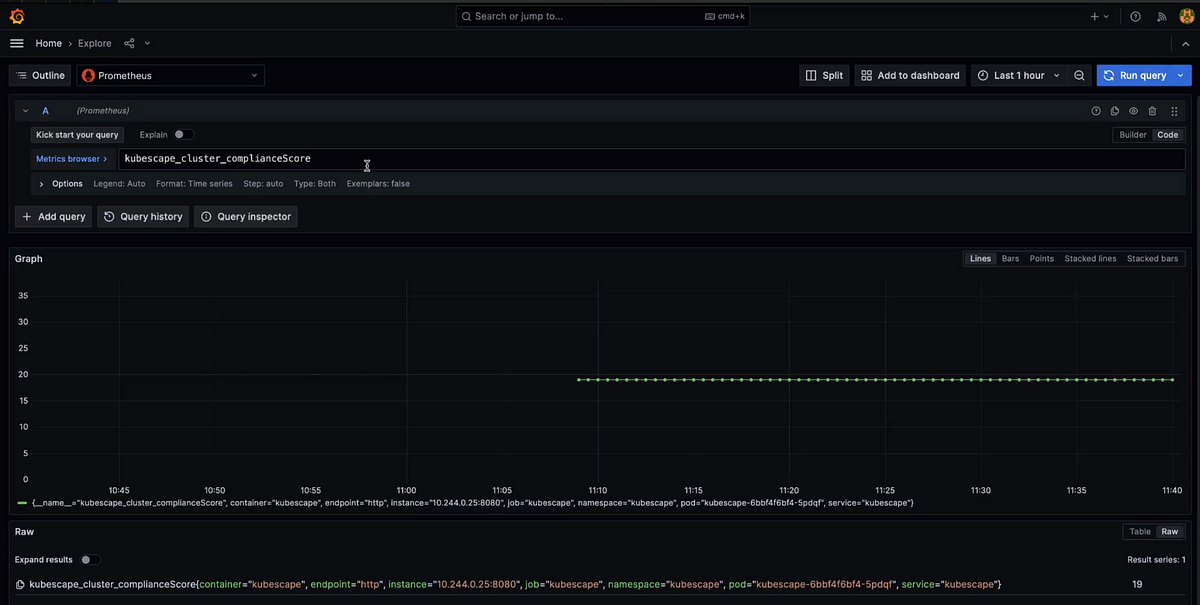
Once at Grafana UI, head to the explore tab and check that kubescape metrics are listed:
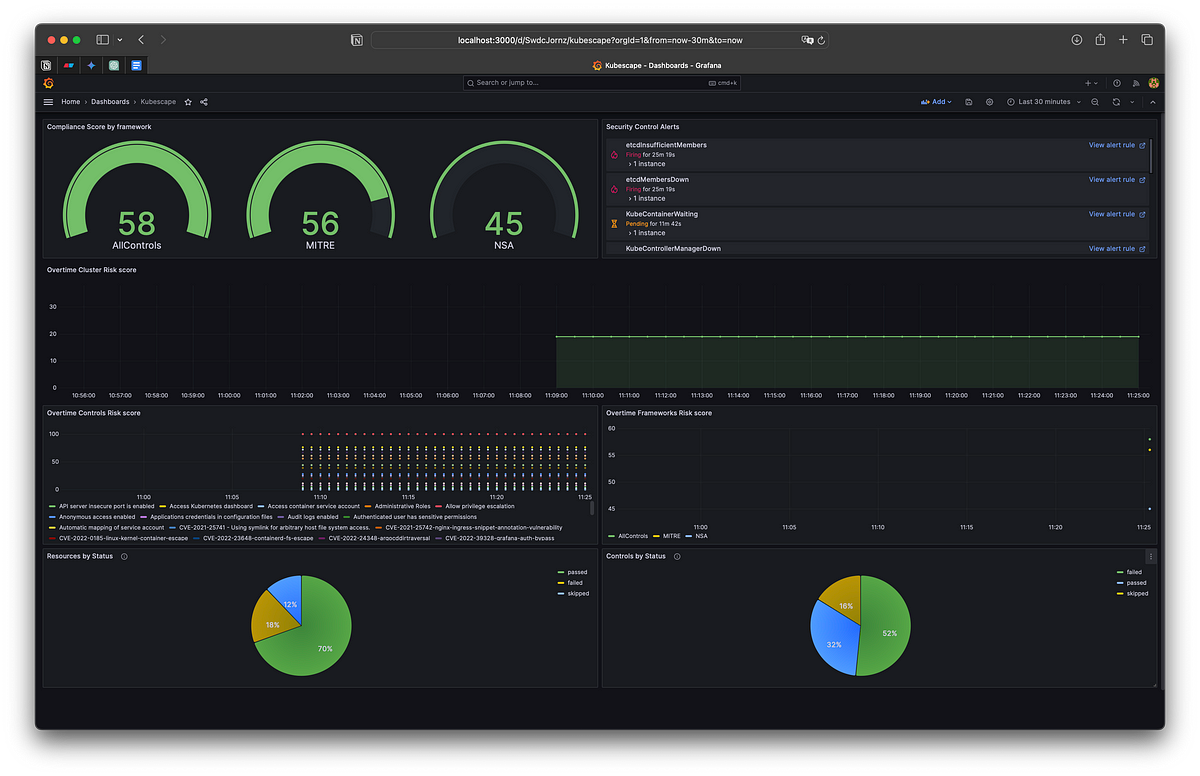
Then, you can download a quick Dashboard to show your security findings graphically:
Add some panels (optional)
You can play around with this dashboard and add you own panels.
Here I added two of them:
I put the source code of this tutorial as well as the Grafana Dashboard above in this Github repo.
Feel free to add a start ⭐ if you find it useful 😉.
devops-labs/50-kubescape at main · aminrj/devops-labs
_Git repo to hold the labs and tutorials made for demonstrations. - devops-labs/50-kubescape at main ·…_github.com
One last thing
Hope you enjoyed the article. If this story provided value and you wish to show a little support, you could:
- Clap a lot of times for this story 👏👏👏
- Highlight the parts more relevant to be remembered (it will be easier for you to find it later, and for me to write better articles)
- Follow me on Medium
- Read my latest articles https://medium.com/@araji
Here some few more resources:
ArgoCD deployment patterns: “App of Apps” Vs. ApplicationSets
_Kubernetes has emerged as the de-facto platform for modern containerized applications._araji.medium.com
Kubernetes Security : Monitor Audit logs with Grafana
_Monitoring Kubernetes audit logs plays an important role in strengthening the overall security posture of the…_araji.medium.com
[Kubernetes Policy-as-Code : Kyverno Vs. OPA


