Proactive Kubernetes Security: Unlocking Threat Detection with Kubescape, Prometheus, and Grafana
Table of Contents
KUBERNETES SECURITY
Kubernetes has revolutionized the way we deploy and manage containerized applications. However, the complexity of Kubernetes environments also brings a unique set of security challenges.
To maintain a strong security posture, it’s critical to implement tools and processes that provide constant visibility into potential vulnerabilities and misconfigurations within your clusters.
This article demonstrates how integrating Kubescape, Prometheus, and Grafana offers a robust solution for achieving superior security insights and monitoring in your Kubernetes environments.

Understanding the Tools
Kubescape
Kubescape is a purpose-built Kubernetes security platform that goes beyond traditional vulnerability scanners.
It assesses your clusters against multiple security frameworks like the NSA Kubernetes Hardening Guidance, MITRE ATT&CK, and others.
Kubescape identifies a wide range of potential risks, including configuration weaknesses, exposed secrets, and vulnerable software components.

Prometheus
Prometheus is a leading open-source monitoring and time-series database. Its powerful query language, flexible alerting capabilities, and scalability make it a popular choice for Kubernetes.
The key advantage of Prometheus lies in its ability to collect, store, and analyze time-series data like the security metrics provided by Kubescape.
Grafana
Grafana is an open-source visualization platform that excels in creating customizable and interactive dashboards.
It can connect to various data sources, including Prometheus, to render informative visualizations.
Grafana brings life to the security data, displaying it in ways that are easy to understand and act upon.
The combination of Kubescape, Prometheus, and Grafana gives the data-driven insights needed to prioritize security efforts
Step-by-Step Walkthrough
Prerequisites
- A running Minikube cluster.
- Terraform installed on your system.
- Basic understanding of Kubernetes concepts and the use of
kubectl.
If you are unfamiliar with these tools, consider reading this article first. It would help with the prerequisites:
Get started with observability with Grafana, Loki, and Promtail
_In today’s dynamic and ever-evolving IT landscape, the need for comprehensive observability has become more crucial…_araji.medium.com
1. Set up Terraform
- Create a new directory for your project.
- Create a file named
main.tfwith the following Terraform configuration:
# Initilize terraform providers
provider “kubernetes” {
config_path = “~/.kube/config”
}
provider “helm” {
kubernetes {
config_path = “~/.kube/config”
}
}
- From the terminal, initialize Terraform:
terraform init
2. Deploy Grafana and Prometheus
Continue on the same file main.tfby adding these Terraform resources:
# Create a namespace for observability
resource “kubernetes_namespace” “observability-namespace” {
metadata {
name = “observability”
}
}
# Prometheus setup
resource “helm_release” “prometheus” {
name = “prometheus”
repository = “https://prometheus-community.github.io/helm-charts"
chart = “prometheus”
version = “25.8.2”
namespace = “observability”
depends\_on = \[kubernetes\_namespace.observability-namespace\]
}
# Grafana setup
resource “helm_release” “grafana” {
name = “grafana”
repository = “https://grafana.github.io/helm-charts"
chart = “grafana”
version = “7.1.0”
namespace = “observability”
values     = \[file("${path.module}/values/grafana.yaml")\]
depends\_on = \[kubernetes\_namespace.observability-namespace\]
}
Before hitting terraform apply, you need to add the Grafana configuration (grafana.yaml) in the values folder (created along your main.tf file) with the following content:
# values/grafana.yaml
persistence.enabled: true
persistence.size: 10Gi
persistence.existingClaim: grafana-pvc
persistence.accessModes[0]: ReadWriteOnce
persistence.storageClassName: standard
adminUser: admin
adminPassword: grafana
datasources:
datasources.yaml:
apiVersion: 1
datasources:
# configure Prometheus datasource
- name: Prometheus
type: prometheus
access: proxy
orgId: 1
url: http://prometheus-server.observability.svc.cluster.local
basicAuth: false
isDefault: false
version: 1
editable: true
Here we specify default admin credentials (only for demonstration purpose, do not try this on a real production cluster 😜).
We also add the data source for Prometheus so we don’t have to add it in the Grafana UI each time we deploy our infrastructure.
Deploy Prometheus and Grafana with terraform applyType ‘yes’ when prompted.
3. Deploy Loki and Promtail
Since, we will be using Loki to send security and Kubernetes audit logs to Grafana along with Kubernetes audit logs, we configure Loki and Promtail as well.
More details on how to configure K8s Audit logs and sending them to Grafana are explained in the article linked at the end 👇.
# Helm chart for Loki
resource “helm_release” “loki” {
name = “loki”
repository = “https://grafana.github.io/helm-charts"
chart = “loki”
version = “5.41.5”
namespace = “observability”
values     = \[file("${path.module}/values/loki.yaml")\]
depends\_on = \[kubernetes\_namespace.observability-namespace\]
}
# Helm chart for promtail
resource “helm_release” “promtail” {
name = “promtail”
repository = “https://grafana.github.io/helm-charts"
chart = “promtail”
version = “6.15.3”
namespace = “observability”
values     = \[file("${path.module}/values/promtail.yaml")\]
depends\_on = \[kubernetes\_namespace.observability-namespace\]
}
The same thing here with the initial configurations of Loki and Promtail, create the following yaml files in the values folder:
# values/loki.yaml
loki:
auth_enabled: false
commonConfig:
replication_factor: 1
storage:
type: ‘filesystem’
singleBinary:
replicas: 1
# values/prometheus.yaml
# Mount folder /var/log from node
extraVolumes:
- name: node-logs
hostPath:
path: /var/log
extraVolumeMounts:
- name: node-logs
mountPath: /var/log/host
readOnly: true
# Add Loki as a client to Promtail
config:
clients:
- url: http://loki-gateway.observability.svc.cluster.local/loki/api/v1/push
# Scraping kubernetes audit logs located in /var/log/kubernetes/audit/
snippets:
scrapeConfigs: |
- job_name: audit-logs
static_configs:
- targets:
- localhost
labels:
job: audit-logs
__path__: /var/log/host/kubernetes/**/*.log
Then, we deploy Loki and Promtail with :terraform apply
4. Install Kubescape
Following the same GitOps approach, we will deploy Kubescape as we did with other observability tools, using Terraform to deploy Kubescape operator Helm chart.
# Install the Kubescape Helm chart
resource “helm_release” “kubescape” {
name = “kubescape”
repository = “https://kubescape.github.io/helm-charts"
chart = “kubescape-operator”
version = “1.18.3”
namespace = “kubescape”
create_namespace = true
depends_on = [kubernetes_namespace.observability-namespace]
set {
name = “clusterName”
value = “minikube”
}
}
After terraform apply.we check that the pods are in a running state:
$ kubectl get po -n kubescape
NAME READY STATUS RESTARTS AGE
kubescape-5dc5cb78c6-m8ss7 1/1 Running 0 20s
kubevuln-65565b7497-tkzjw 1/1 Running 0 20s
operator-86c99bbf74-8g9xk 1/1 Running 0 13s
storage-5bdb8b54ff-lzs58 1/1 Running 0 20s
This Helm chart deploys the Kubescape-operator that contains both Kubevuln and kubescape.
At this point, we can view the results directly using kubectl as follow:
View configuration scan summaries:
kubectl get workloadconfigurationscansummaries -A
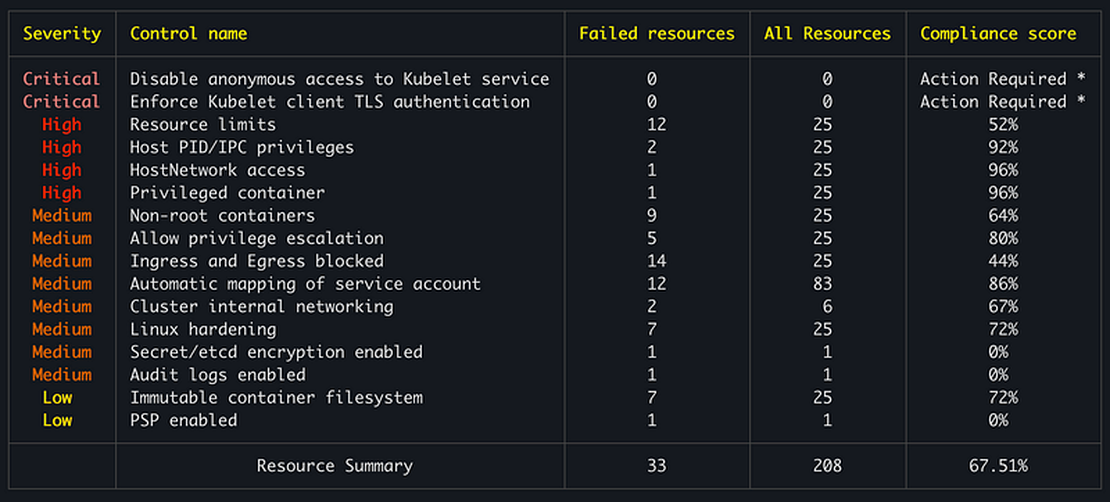
And we can run kubescape with the CLI to get a quick idea on how our cluster is doing 🤞:
$ kubescape scan framework nsa
✅ Initialized scanner
✅ Loaded policies
✅ Loaded exceptions
✅ Loaded account configurations
✅ Accessed Kubernetes objects
Control: C-0017 100% |███████████████████████████████████████████████| (24/24, 71 it/s)
✅ Done scanning. Cluster: minikube
✅ Done aggregating results
──────────────────────────────────────────────────
Framework scanned: NSA
┌─────────────────┬────┐
│ Controls │ 24 │
│ Passed │ 8 │
│ Failed │ 14 │
│ Action Required │ 2 │
└─────────────────┴────┘
Failed resources by severity:
┌──────────┬────┐
│ Critical │ 0 │
│ High │ 16 │
│ Medium │ 51 │
│ Low │ 8 │
└──────────┴────┘
Run with ‘–verbose’/’-v’ to see control failures for each resource.
┌──────────┬─────────────────────────────────────────────┬──────────────────┬───────────────┬───────────────────┐
│ Severity │ Control name │ Failed resources │ All Resources │ Compliance score │
├──────────┼─────────────────────────────────────────────┼──────────────────┼───────────────┼───────────────────┤
│ Critical │ Disable anonymous access to Kubelet service │ 0 │ 0 │ Action Required * │
│ Critical │ Enforce Kubelet client TLS authentication │ 0 │ 0 │ Action Required * │
│ High │ Resource limits │ 12 │ 25 │ 52% │
│ High │ Host PID/IPC privileges │ 2 │ 25 │ 92% │
│ High │ HostNetwork access │ 1 │ 25 │ 96% │
│ High │ Privileged container │ 1 │ 25 │ 96% │
│ Medium │ Non-root containers │ 9 │ 25 │ 64% │
│ Medium │ Allow privilege escalation │ 5 │ 25 │ 80% │
│ Medium │ Ingress and Egress blocked │ 14 │ 25 │ 44% │
│ Medium │ Automatic mapping of service account │ 12 │ 83 │ 86% │
│ Medium │ Cluster internal networking │ 2 │ 6 │ 67% │
│ Medium │ Linux hardening │ 7 │ 25 │ 72% │
│ Medium │ Secret/etcd encryption enabled │ 1 │ 1 │ 0% │
│ Medium │ Audit logs enabled │ 1 │ 1 │ 0% │
│ Low │ Immutable container filesystem │ 7 │ 25 │ 72% │
│ Low │ PSP enabled │ 1 │ 1 │ 0% │
├──────────┼─────────────────────────────────────────────┼──────────────────┼───────────────┼───────────────────┤
│ │ Resource Summary │ 33 │ 208 │ 67.51% │
└──────────┴─────────────────────────────────────────────┴──────────────────┴───────────────┴───────────────────┘
However, we want to use our monitoring setup to visualize our findings in a more automated and continuous way.
Visualize Kubescape scans with Grafana
To access the Grafana UI, we need to get access to the cluster.
Since we are using a local minikube cluster, the easiest way to access the Grafana service is to create a port-forward using the command.
This command forward traffic from our cluster on port 80 to our local machine on port 3000.
kubectl port-forward -n observability svc/grafana 3000:80
We add Loki as a data source to our Grafana as we did for Prometheus, by updating the existing values/grafana.yml:
# values/grafana.yaml
datasources:
datasources.yaml:
# Prometheus data source
…
# Loki data source
apiVersion: 1
datasources:
- name: Loki
type: loki
access: proxy
orgId: 1
url: http://loki-gateway.observability.svc.cluster.local
basicAuth: false
isDefault: true
version: 1
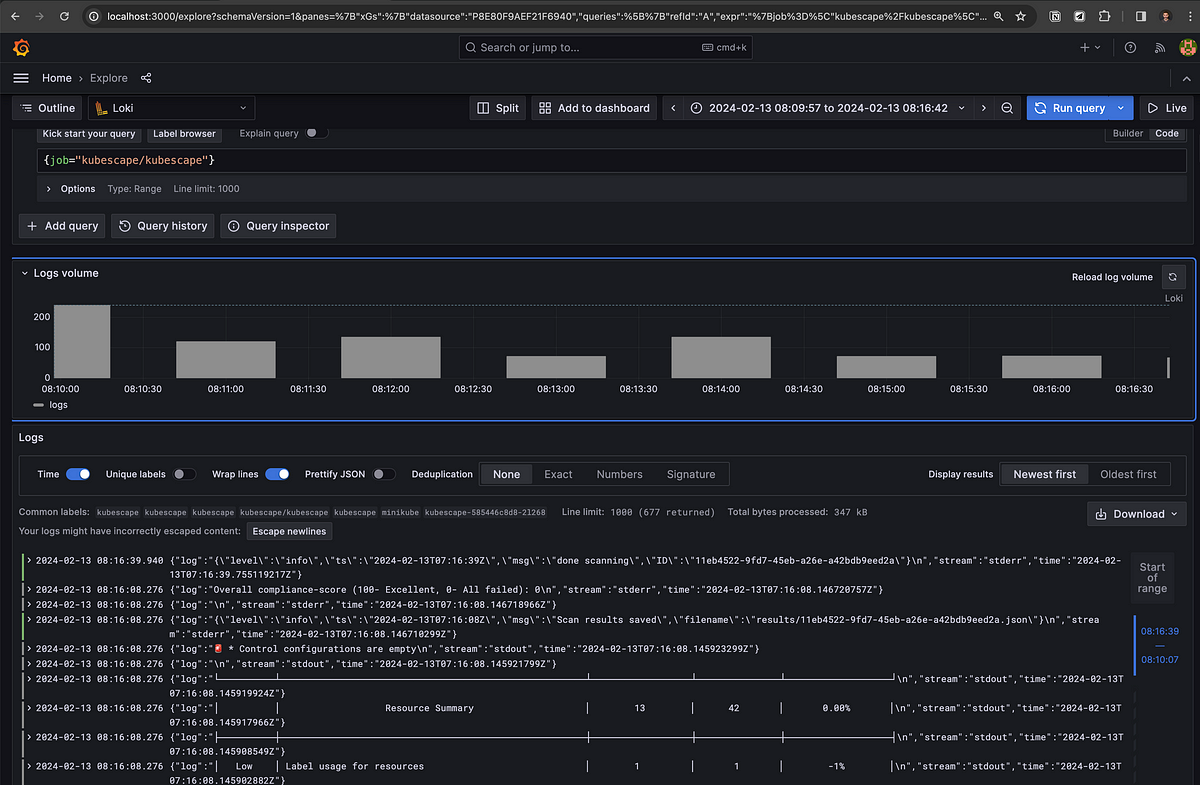
We head to the Explore tab to start analyzing our vulnerabilities and image scans:

Congratulations! Your security scans and audit logs are now streaming continuously from your cluster to Prometheus and Grafana. The stage is set for unlocking truly powerful insights.
Next up, we’ll delve into the languages of PromQL and LogQL. With these tools, you’ll transform raw security data into visually compelling Grafana dashboards.
You can even configure AlertManager and your observability stack to proactively notify you of security incidents.
To keep things focused, I’ll save the exploration of dashboards and alerting for a follow-up article. Stay tuned — with this foundation in place, you’re about to become a Kubernetes security visualization pro!
Key Benefits of this Setup
- Proactive Risk Identification: Kubescape proactively scans Kubernetes clusters, applying various security frameworks to pinpoint potential issues. This approach shifts security from a purely reactive posture to one that emphasizes prevention.
- Historical Trend Analysis: Prometheus stores Kubescape’s security metrics over time. This historical data allows you to analyze security trends, identify patterns, and measure the effectiveness of your security controls as your infrastructure evolves.
- Actionable Visualizations: Grafana dashboards translate the raw metrics into clear and compelling visualizations. You can design dashboards showcasing critical security indicators, risks associated with specific workloads or namespaces, compliance status, and more. These visualizations help to quickly grasp the state of the cluster’s security and identify areas that need immediate attention.
- Data-Driven Security Improvements: Security teams often operate under pressure with limited resources. The combination of Kubescape, Prometheus, and Grafana gives the data-driven insights needed to prioritize security efforts. Track remediation progress, compare risk levels across clusters, and optimize security investments based on clear metrics.
- Streamlined Audit and Compliance: If the organization faces industry-specific or regulatory compliance requirements, this integrated setup plays a vital role. Kubescape can scan against standards like PCI DSS, NIST,or HIPAA. Visual dashboards built in Grafana provide historical records and reporting functions to ease the auditing process.
What about “Continuous Scanning” ?
Kubescape empowers cluster operators with a dynamic view of their Kubernetes environment’s security posture through its Continuous Scanning feature.
Upon activation, Kubescape diligently monitors your cluster for configuration changes and vulnerabilities, analyzing their potential security implications.
This analysis is presented in comprehensive reports spanning cluster-wide, namespace-specific, and individual workload levels.
Continuous Scanning keeps you constantly informed with the most up-to-date insights into your cluster’s security status.
Continuous Scanning is built into the Kubescape Operator Helm chart. To use this capability, you need to enable it. Start by navigating to the kubescape.yamlvalues file and make sure that the corresponding capabilities.continuousScan key is set to enable, like so:
capabilities:
continuousScan: enable # Make sure this is set to “enable”
Once you apply the chart with the capability enabled, Kubescape will continuously provide the scan results and update your Grafana dashboards.
The takeaway
Kubescape excels at identifying security risks, Prometheus provides robust storage and analysis of security metrics, and Grafana offers visually informative representations of this data.
By using these tools together, you gain a comprehensive, continuously updated view of your Kubernetes security posture, empowering you to make informed decisions, effectively prioritize security tasks, and demonstrate compliance with confidence.
One more thing
Enjoyed this article? Follow me for more actionable Kubernetes security guides, best practices, and real-world examples.
Want to take your security knowledge to the next level? Join my mailing list [here] — I share valuable tips and insights that won’t be published anywhere else. (and I won’t ever share your email 😊)
If you want to start tracking your Kubernetes audit logs with a similar setup, consider having a look here:
Kubernetes Security : Monitor Audit logs with Grafana
_Monitoring Kubernetes audit logs plays an important role in strengthening the overall security posture of the…_araji.medium.com
I hope this deep dive into Kubernetes security was insightful! 🚀 Ready to take your skills to the next level? Let’s connect and continue the conversation:
- Follow Me: Twitter:https://twitter.com/aminerj for updates, discussions, and more security best practices. 💡
- Questions or Feedback: Share your thoughts on the article or hit me up if you have any specific Kubernetes security challenges. 💬

